Mortgage-free homes accounted for 41% of U.S. owner-occupied properties in 2025, up from 32.8% in 2010, according to housing research released November 16, 2026. However, a growing share of homeowners aged 75 and older still carry mortgage debt, revealing a different pattern among older households despite the national increase in outright ownership.
Key Takeaways
- Mortgage-free homes represented 41% of U.S. owner-occupied properties in 2025, compared with 32.8% in 2010
- Among homeowners aged 75 and older, the mortgage-free share declined from 79.7% to 71.3% over the same period
- West Virginia recorded the highest statewide mortgage-free share at 56.6%, while the District of Columbia had the highest share carrying mortgages at 73.5%
- Freddie Mac reported an average 30-year fixed mortgage rate of 7.11% on November 12, 2026
New research from Realtor.com senior economist Jiayi Xu, based on the U.S. Census Bureau’s 2025 American Community Survey, shows that outright homeownership has become more common nationally. The figures cover owner-occupied housing units rather than rental properties, vacant homes or the entire residential housing stock.
The findings also highlight differences between homeowners who have completed their mortgage payments and those who continue financing their properties. Those differences can affect monthly expenses, relocation decisions and the financial considerations involved in purchasing another home.
Mortgage-Free Homes Increase as Borrowing Costs Remain Elevated
The share of U.S. homeowners carrying mortgage debt fell from 67.2% in 2010 to 59% in 2025, according to the November 16 analysis. During that period, the proportion of mortgage-free homes increased by 8.2 percentage points.
The comparison reflects changes in the overall composition of homeownership. It does not identify how many individual households paid off their mortgages during that period or distinguish between owners who eliminated existing debt and those who purchased properties outright.
Borrowing costs remain an important consideration for homeowners planning to relocate. Freddie Mac’s November 12 Primary Mortgage Market Survey placed the average 30-year fixed mortgage rate at 7.11%, down from 7.18% the previous week.
The latest reading marked a fourth consecutive weekly decline. However, the average remained above the 6.24% recorded during the corresponding period in 2025.
These recent mortgage rate declines provide context for homeowners comparing existing loan payments with the cost of financing another property.
A separate November 11 Realtor.com analysis estimated that the typical mortgage holder would face an increase in monthly principal-and-interest payments from $1,332 to $2,468 when purchasing a median-priced home under its modeling assumptions.
That represents an 85.3% increase, calculated using a 7.32% mortgage rate and a 14.3% down payment. The estimates represent a modeled purchasing scenario rather than the actual expenses of every household.
Homeowners without outstanding mortgages face different financing considerations because they do not have existing monthly mortgage principal-and-interest payments. However, their ability to purchase another property still depends on available funds, property prices and any new borrowing required.
Mortgage-Free Ownership Varies Across U.S. Housing Markets
The national increase in mortgage-free homes is not evenly distributed across the country. Regional data reveal differences in how frequently homeowners rely on mortgage financing.
In the West, 63.8% of owner-occupied homes carried mortgage debt in 2025, the highest proportion among the four Census regions. The South recorded the lowest share at 56.8%, while the Midwest and Northeast each stood at 58.7%.
State-level figures showed a wider range.
West Virginia had the highest mortgage-free ownership share at 56.6%, followed by Mississippi at 52.7%. New Mexico recorded an even split between homes with mortgages and homes owned outright.
The District of Columbia had the highest proportion of owner-occupied properties carrying mortgage debt at 73.5%. Maryland followed at 69.4%, while Colorado recorded 68.4%.
Differences also appeared among the country’s 50 largest metropolitan areas.
Miami had the highest mortgage-free share at 45.9%, followed by Buffalo at 45.6% and Pittsburgh at 45.5%. The Washington metropolitan area recorded a substantially lower mortgage-free share of 26.8%.
These geographic differences provide context for evaluating local housing conditions. However, mortgage status alone does not establish whether a market is affordable or whether homeowners are more likely to sell.
Additional housing data illustrate the cost pressures facing potential buyers. The National Association of Home Builders/Wells Fargo Cost of Housing Index found that a median-income household needed 36% of its income to cover the mortgage payment on a median-priced existing home during the second quarter of 2026.
The measure includes estimated taxes, insurance and private mortgage insurance under its financing assumptions. It provides additional context for U.S. housing affordability pressures beyond the outstanding mortgage balances of current homeowners.
More Homeowners Aged 75 and Older Continue Carrying Mortgages
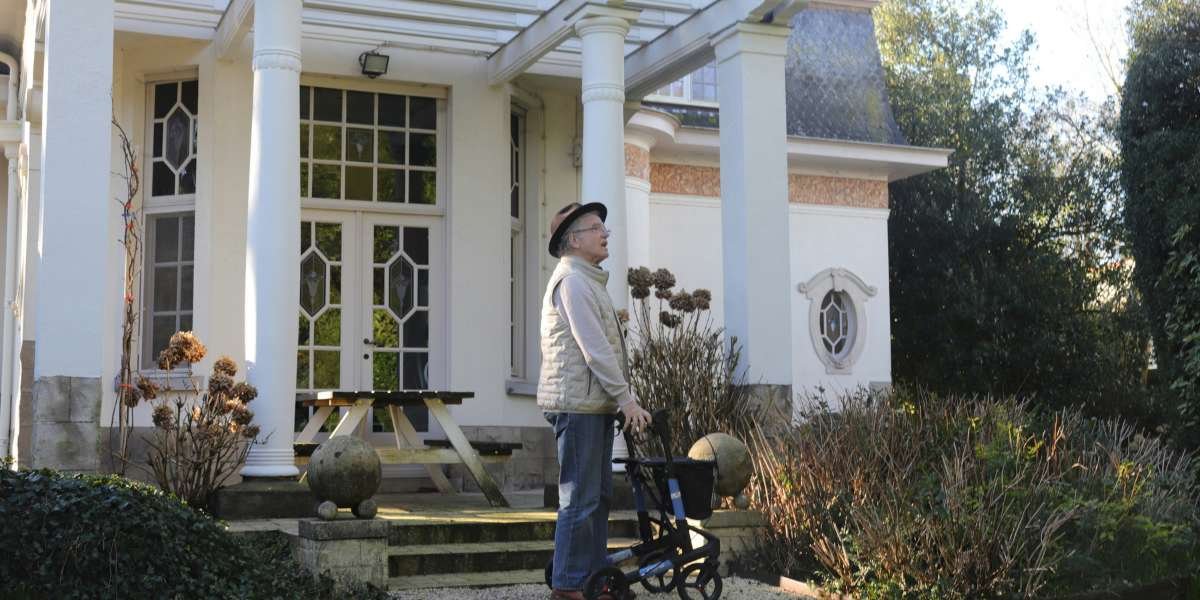
The strongest contrast in the housing research concerns homeowners aged 75 and older.
Although this age group remains more likely to own property outright than younger homeowners, its mortgage-free share has declined over time.
In 2010, approximately 79.7% of homeowners aged 75 and older owned their properties without mortgage debt. By 2025, that proportion had fallen to 71.3%.
Meanwhile, the homeownership rate among households in this age group increased from 75.7% to 78.3%.
The number of mortgage-free owner households aged 75 and older rose from approximately 7.03 million in 2010 to 9.75 million in 2025. However, the number carrying mortgages increased more rapidly, from 1.79 million to 3.93 million.
Consequently, the share of older owner households with mortgages climbed from 20.3% to 28.7%.
The findings establish a change in mortgage ownership patterns but do not identify a single explanation. They also do not establish whether individual homeowners borrowed later in life or continued making payments on loans obtained earlier.
Regional differences remain visible among older households.
Grand Rapids, Michigan, recorded the highest mortgage-free share among homeowners aged 75 and older across the 50 largest metropolitan areas, at 79.2%. Pittsburgh followed at 78.4%, while Riverside, California, recorded the lowest share at 55.2%.
Mortgage obligations are only one component of housing expenses for older owners. Property taxes, insurance, maintenance and repairs continue regardless of whether a home has an outstanding loan.
The Federal Reserve’s May 2026 report on household economic well-being found that 6% of homeowners went without homeowners insurance in 2025, with cost cited by most uninsured respondents. Among insured homeowners, 20% said they could not afford as much coverage as they wanted.
The findings provide additional context for interpreting mortgage-free ownership. Having no outstanding mortgage eliminates one recurring borrowing expense, but it does not necessarily establish a household’s overall financial position.
Frequently Asked Questions
What percentage of U.S. homes were mortgage-free in 2025?
Mortgage-free homes accounted for 41% of owner-occupied U.S. properties in 2025, according to the American Community Survey-based analysis released November 16, 2026. The figure increased from 32.8% in 2010 and excludes rental and vacant properties.
Why are more older homeowners carrying mortgages?
The study found that the share of homeowners aged 75 and older carrying mortgages increased from 20.3% in 2010 to 28.7% in 2025. The research does not establish a single cause for the increase or determine when those homeowners obtained their loans.
Which states have the highest mortgage-free ownership rates?
West Virginia recorded the highest mortgage-free ownership share at 56.6%, followed by Mississippi at 52.7%. New Mexico had an even split between owner-occupied properties with mortgages and those owned outright.
Does owning a home without a mortgage eliminate housing costs?
No. Homeowners without mortgages still face property taxes, insurance, maintenance and other ownership expenses. These costs vary depending on property characteristics and location.