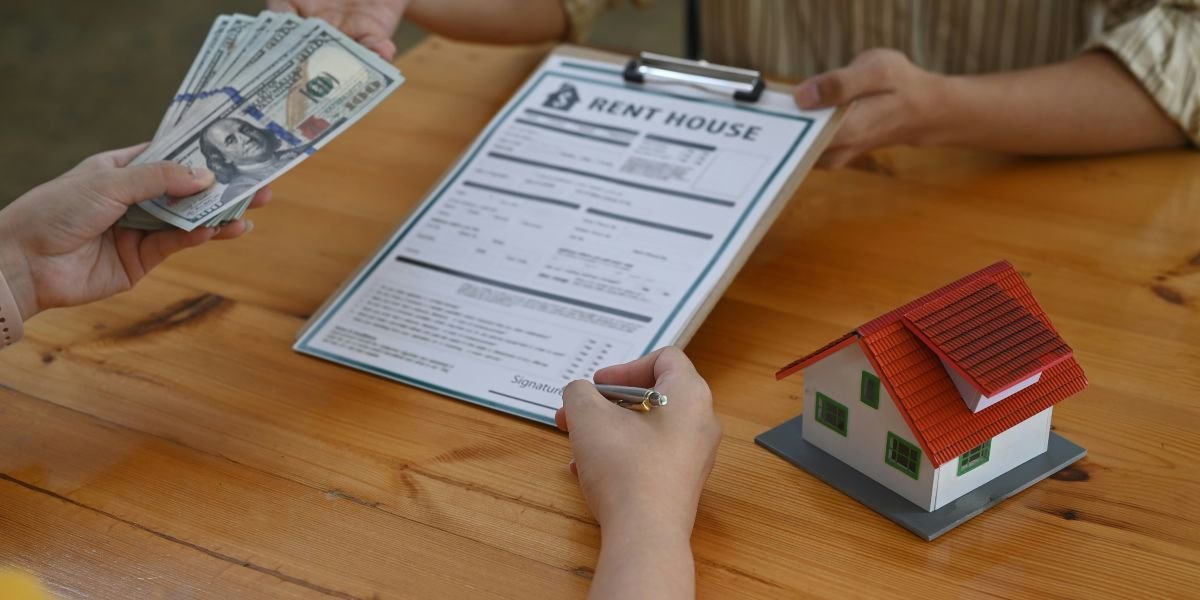
Renting a Home Requires $14,408 Less Annual Income Than Buying, according to Zillow’s November 12, 2026, rental report. The analysis puts typical single-family rent at $2,243 a month and estimated ownership costs at $2,603. The figures highlight how borrowing costs, regional prices and upfront savings influence household housing decisions.
Key Takeaways
- Zillow estimates a $360 monthly difference between renting and owning a typical single-family house with 20% down
- The annual income thresholds are $89,724 for renting and $104,132 for owning under a 30% housing-cost benchmark
- San Jose has the largest modeled income gap, at $214,364, while Buffalo has no gap in the analysis
- Zillow’s renter demand index rose 22.1% nationally over the past year, including 24.3% for single-family rentals
Zillow’s $14,408 figure describes additional annual income needed under its affordability model, not a salary requirement imposed by lenders. Borrowers’ credit, debt and down payments can change the amount a lender approves.
Borrowing costs remain a factor. Freddie Mac’s average 30-year fixed mortgage rate declined to 7.11% on November 12 from 7.18% a week earlier, but stood above the 6.24% average recorded a year before. An average rate is not a guaranteed offer to an individual buyer.
Renting a Home Carries a Lower Income Threshold
The $360 monthly difference equals $4,320 over 12 months. Zillow arrived at the larger $14,408 annual income gap by applying the conventional guideline that housing costs should not exceed 30% of gross household income. On that basis, renting calls for $89,724 annually and owning for $104,132.
The ownership estimate assumes a 20% down payment. Households paying less upfront could face different mortgage costs, including mortgage insurance in some cases. Closing expenses, home repairs and the amount held in emergency savings also affect the financial comparison. Rental deposits and moving expenses create separate upfront costs for tenants.
The estimated income gap has widened since February 2026, when Zillow put it at $6,463. The new figure is the largest the company has calculated since early 2025.
“For a growing number of households, renting a house is a legitimate financial strategy,” said Kara Ng, a senior economist at Zillow.
Local Housing Markets Show Wide Differences in Affordability
The biggest differences appeared in several expensive coastal markets. Zillow calculated an annual income gap of $214,364 in San Jose, California, where buying required an estimated $404,925 in household income versus $190,561 to rent. San Francisco followed at $139,353, with San Diego at $84,101, New York at $78,208 and Los Angeles at $78,003.
The gaps were considerably smaller elsewhere. Pittsburgh’s difference was $2,554, Houston’s was $4,500 and Cincinnati’s was $4,774. Buffalo was the only metro where the modeled income required to buy did not exceed that needed to rent. Dallas showed a $17,809 gap, compared with $12,589 in Miami and $36,795 in Austin.
The figures do not describe every home within those regions. Property prices, insurance costs, taxes and available rentals vary across neighborhoods. Entry-level buyers also face differences in the supply of lower-priced listings, as reflected in recent data on starter-home availability.
That makes a neighborhood-level comparison more useful than assuming the national $360 difference applies locally. Two properties offering similar space can carry materially different recurring costs depending on location and condition.
Rental Demand Increases While Ownership Costs Remain Uneven
Zillow’s Observed Renter Demand Index increased 22.1% nationally from a year earlier. Demand for single-family rentals rose 24.3%, compared with 12.1% for multifamily properties. The index measures engagement with rental listings on Zillow and should not be confused with a count of leases signed.
Typical single-family rent increased 3.2% over the year to $2,243 in October. Multifamily rent reached $1,744, up 2.5%. Demand also differed by metro, rising 78.9% in San Jose and 59.6% in Austin while declining 4.3% in Providence.
For prospective buyers, the total monthly obligation includes more than mortgage principal and interest. Property taxes, homeowners insurance and maintenance may alter the budget. Recent figures on home insurance costs illustrate why a lower purchase price does not necessarily produce a lower all-in payment.
Zillow’s November 12 release also cites a national break-even ownership period of 7.8 years with 20% down. That modeled timeline considers the costs of renting and owning over time, rather than assuming that the lower monthly payment always determines the better option. Individual results depend on the home, financing and duration of occupancy.
Frequently Asked Questions
How much income does a household need to rent or buy?
Zillow estimates that a household needs $89,724 annually to afford typical single-family rent and $104,132 to afford ownership with 20% down. Those thresholds use a 30% housing-cost guideline, not lender eligibility rules.
Does renting a home always cost less than buying?
No. The finding that renting a home requires $14,408 less annual income than buying is a national modeled comparison, and the gap differs significantly by city. Buffalo showed no additional modeled income requirement for buying.
What does the $360 monthly gap include?
It compares Zillow’s typical single-family rent of $2,243 with estimated ownership costs of $2,603 under a 20% down-payment assumption. It does not represent every household’s costs or account for saving the initial down payment.
How long would ownership take to break even?
Zillow’s November 12 report cited a 7.8-year national break-even period with 20% down. The estimate depends on modeling assumptions and does not determine the outcome for an individual property.