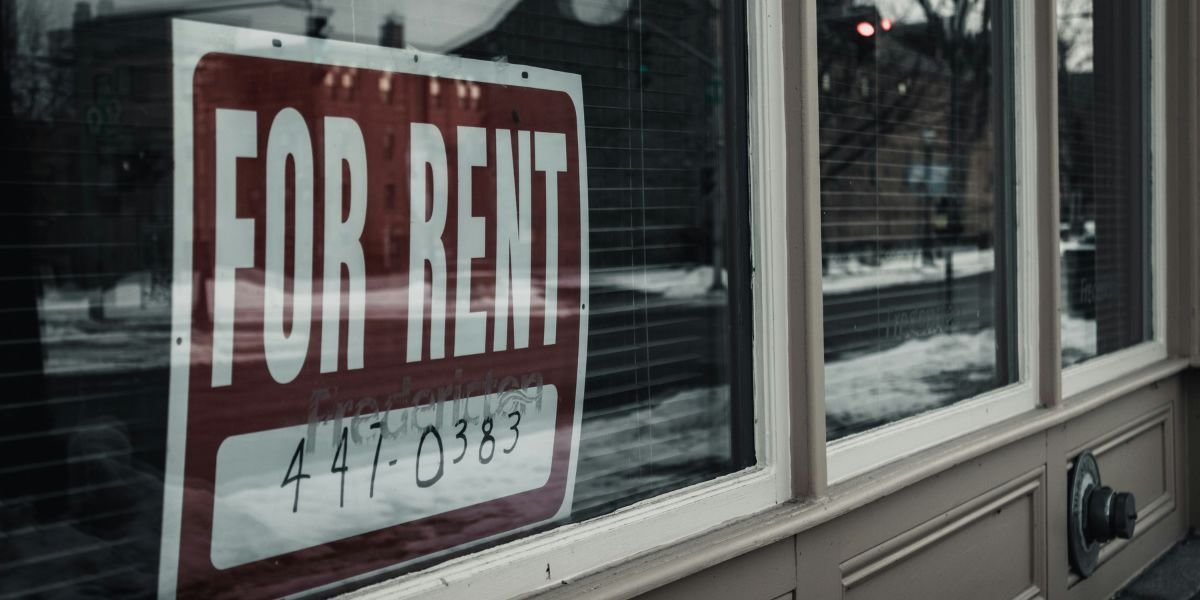
U.S. median asking rents increased annually in October 2026 for the first time since June 2023. The report recorded a slight increase across major metropolitan areas, while fewer multifamily construction completions and declining apartment development activity provided additional context for changing rental market conditions.
Key Takeaways
- U.S. median asking rent reached $1,692 in October 2026, increasing 0.1% year over year.
- October marked the first annual rent increase since June 2023.
- Two-bedroom asking rents increased 0.3% annually to $1,889.
- Multifamily completions declined 26% year over year in the third quarter.
- The number of multifamily units under construction fell 2.7% to 674,000.
U.S. Median Asking Rents Increase in October 2026
The U.S. rental market recorded a 0.1% annual increase in median asking rent in October 2026, according to Realtor.com’s monthly rental report. The median asking price across studio, one-bedroom and two-bedroom properties in the 50 largest metropolitan areas reached $1,692.
October’s increase ended a period of annual rent declines that began after June 2023. The change was relatively small, representing a $1 increase compared with October 2025, but it marked the first time the national measure recorded positive annual growth in more than three years.
The report measures asking rents for rental properties rather than the average amount paid by all existing tenants. Its figures therefore provide an indication of advertised rental prices in major metropolitan markets, rather than a complete measure of household rental expenses.
The distinction matters when interpreting the results. Asking rents represent prices associated with properties being offered for rent, while existing lease agreements may reflect different amounts negotiated at earlier dates.
The October figures also provide a national comparison across three apartment categories. Although the combined median increased slightly, individual unit sizes recorded different annual movements.
The change in the overall measure does not mean that every apartment became more expensive. Instead, the figures indicate that the combined asking rent across the measured property categories was higher than the corresponding level one year earlier.
The report provides a reference point for examining rental prices alongside residential construction activity. Its findings also offer information about the relationship between advertised apartment prices and the number of multifamily properties entering the housing market. Separate measures of U.S. multifamily vacancy rates provide additional information about apartment occupancy and available rental inventory.
Apartment Rental Prices Record Different Changes by Unit Size
The October report recorded different annual asking rent movements across studio, one-bedroom and two-bedroom apartments.
Two-bedroom properties experienced the largest increase among the three categories. Their median asking rent reached $1,889, representing a 0.3% increase compared with October 2025.
One-bedroom asking rents also increased, although at a smaller rate. The median reached $1,566, up 0.1% year over year.
Studio apartments moved in the opposite direction. Their median asking rent declined 1.2% annually to $1,411, extending the category’s annual decline to 39 consecutive months.
These figures show that the overall increase was not shared equally across apartment sizes. Two-bedroom properties recorded the strongest annual growth, while studio rentals continued to experience lower asking prices compared with the previous year.
The differences also provide a more detailed view of the rental market than the combined median alone. A single national figure can conceal variations between property categories, particularly when apartment sizes experience different pricing movements.
For renters comparing available properties, the reported figures provide separate reference points for different apartment configurations. The median asking rent for a two-bedroom property was $478 higher than the studio median in October.
The one-bedroom median stood between those two categories, at $155 below the two-bedroom figure and $155 above the studio figure.
These comparisons describe the reported asking rent levels rather than the total cost of renting. They do not account for additional expenses that may apply to individual properties, such as utilities, parking or other housing-related charges.
The continued annual decline in studio rents also contrasts with the increases recorded for larger apartments. This difference means that the October results should not be interpreted as a uniform increase across the entire apartment rental market.
Comparisons between rental expenses and homeownership costs also provide a separate measure of housing affordability. Recent rent-versus-buy cost comparisons examine differences in monthly housing expenses across major metropolitan areas.
Multifamily Construction Completions Decline Across the United States
Multifamily construction figures provide additional context for the rental market’s October results. Realtor.com’s report recorded approximately 330,000 multifamily housing completions in the third quarter of 2026, representing a 26% decline from the same period in 2025.
Completed apartments add rental properties to the available housing stock when units enter the market. Changes in completion volumes therefore provide information about the number of newly constructed units becoming available to prospective tenants.
The third-quarter decline indicates that fewer multifamily units were completed compared with the corresponding period a year earlier.
Construction completions are different from housing starts and building permits. Completions measure units that have reached the end of the construction process, while starts record projects that have begun construction. Building permits measure authorizations for proposed residential development.
These measurements track separate stages of the construction process. A decline in completed apartments does not necessarily mean that every construction project has stopped or that no additional rental properties will enter the market.
However, completion figures provide a direct measure of new multifamily housing delivered during the reporting period.
The 26% annual decline offers important context for understanding the October rental figures because apartment construction contributes to the supply of properties available for rent.
The relationship between construction and asking rents is not determined by completions alone. Rental prices also vary across metropolitan areas and apartment categories. The report’s figures establish that lower multifamily completion volumes coincided with the return of annual growth in the combined asking rent measure.
Apartment Development Activity Provides Context for Rental Supply
The number of multifamily housing units under construction also declined in the third quarter of 2026.
Realtor.com’s report placed the total at 674,000 units, representing a 2.7% decrease compared with the previous year.
Units under construction represent residential projects that have started but have not yet been completed. These properties form part of the future housing supply pipeline, although their eventual availability depends on construction progress and completion.
The decline provides another measure of activity within the multifamily development sector. Alongside the reduction in completed units, it indicates that the volume of apartments in the construction pipeline was lower than a year earlier.
Multifamily construction starts also decreased. The report recorded 403,000 new starts, a 9.2% annual decline.
Construction starts, units under construction and completions measure different stages of apartment development. Taken together, they provide a more detailed picture of residential construction activity than any single figure.
The decrease in starts indicates fewer multifamily units began construction during the measured period. The reduction in units under construction provides information about the number of projects currently progressing, while completions measure properties delivered during the quarter.
For developers, these figures provide a reference for assessing the scale of multifamily building activity. For landlords and property managers, completed apartment projects represent additions to the rental property market.
Development expenses also form part of the conditions affecting apartment construction. Separate data on multifamily construction costs tracks changes in the prices of inputs used in residential and commercial building projects.
The figures also help explain the connection between residential development and rental availability. New apartment construction can increase the number of properties competing for tenants, while changes in the volume of completed units affect the number of newly delivered properties entering the market.
The October rental report places these construction measurements alongside asking rent data, allowing the two sets of figures to be considered together without treating construction activity as the sole explanation for rental price movements.
Rental Market Conditions Differ Across Major U.S. Metropolitan Areas
Realtor.com’s October rental report covered the 50 largest U.S. metropolitan areas, providing a broad measure of asking rent conditions across major urban markets.
The national median combines rental listings from these metropolitan areas. It therefore provides an overall reference point rather than an identical price measure for every city or region.
Differences between apartment sizes already show that rental price movements were not uniform across the measured properties. The 0.3% increase for two-bedroom apartments and the 0.1% increase for one-bedroom units contrasted with the 1.2% decline for studios.
The combined national figure also does not establish that every metropolitan area recorded an annual increase. Individual markets can have different asking rent levels and year-over-year movements.
The report’s coverage of 50 metropolitan areas allows rental conditions to be examined across a range of major housing markets. However, the national median should not be treated as the prevailing rental price in any specific city.
For renters, local asking prices provide a more direct reference when comparing available apartments. Landlords and property managers can also use metropolitan-level information to assess the rental environment in the areas where their properties operate.
Residential developers can consider local rental conditions alongside construction figures when examining apartment supply and development activity.
The October results provide a national benchmark for subsequent comparisons of asking rents and multifamily construction. Separate measurements of studio, one-bedroom and two-bedroom properties also allow future reports to track whether rental price movements remain different across apartment categories.
Frequently Asked Questions
What was the median U.S. asking rent in October 2026?
The median asking rent across studio, one-bedroom and two-bedroom properties in the 50 largest U.S. metropolitan areas was $1,692. This represented a 0.1% increase compared with October 2025.
When did U.S. rents last record an annual increase?
The previous annual increase was recorded in June 2023, according to Realtor.com. October 2026 was the first month with positive annual growth since then.
Which apartment sizes recorded rent increases in October 2026?
Two-bedroom asking rents increased 0.3% annually to $1,889, while one-bedroom rents rose 0.1% to $1,566. Studio asking rents declined 1.2% to $1,411.
How many multifamily housing units were completed in the third quarter of 2026?
Approximately 330,000 multifamily units were completed during the third quarter. This represented a 26% decline compared with the same period in 2025.
Which U.S. metropolitan areas recorded the largest rental price changes?
The report covered the 50 largest U.S. metropolitan areas, but the national figures presented here do not establish a ranking of metropolitan areas by rental price changes. The combined median should not be interpreted as an individual city’s asking rent.