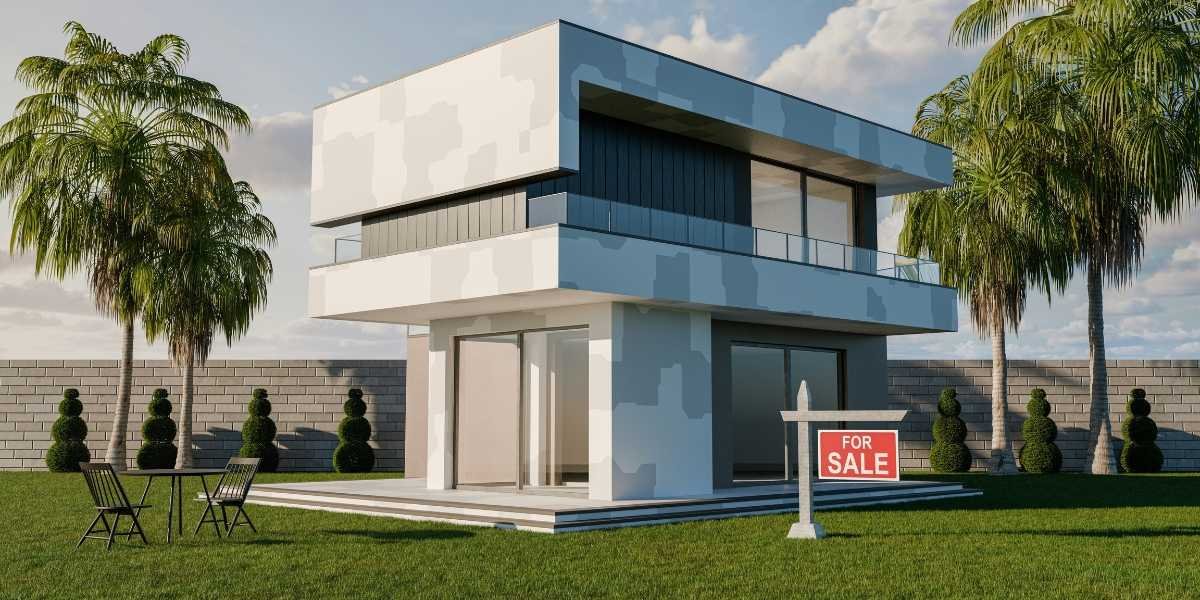
The U.S. luxury housing market recorded its 31st consecutive month of year-over-year declines in entry-level luxury listing-price thresholds in October 2026, according to Realtor.com’s latest Luxury Housing Report. The national threshold fell 2.3% to $1,197,014, although several metropolitan areas, particularly in Florida, reported increases.
Key Takeaways
- The national entry-level luxury listing-price threshold declined 2.3% year over year to $1,197,014 in October 2026
- All three national luxury price thresholds recorded their 31st consecutive month of annual declines
- The 95th-percentile threshold fell 4.1% to $1,873,040, while the 99th-percentile threshold declined 6.2% to $5,125,874
- Naples-Marco Island, Florida, led metropolitan luxury-price growth at 9%, followed by North Port-Bradenton-Sarasota at 7.7%
- Luxury listings spent a median of 73 days on the market, five fewer than in October 2025
National Luxury Housing Prices Continue Annual Declines
Realtor.com’s October 2026 Luxury Housing Report showed that the national entry-level luxury listing-price threshold fell to $1,197,014, representing a 2.3% decline from October 2025.
The report defines entry-level luxury as the 90th percentile of residential listing prices, representing the starting price for the most expensive 10% of available homes. This measure reflects asking prices rather than completed property transactions.
The decline occurred alongside broader seller asking price adjustments across the U.S. residential market. However, changes in the national luxury threshold do not necessarily reflect the same conditions affecting lower-priced properties or individual metropolitan markets.
Realtor.com’s findings also showed that the national declines extended beyond entry-level luxury listings. Higher-priced segments experienced larger percentage decreases, indicating differences in pricing movements across the upper portion of the market.
Luxury Listing Thresholds Fall Across Three Price Segments
The October report recorded year-over-year decreases across all three national luxury listing-price thresholds.
The 90th-percentile threshold declined 2.3% to $1,197,014, while the 95th-percentile threshold fell 4.1% to $1,873,040. The 99th-percentile threshold recorded the largest percentage decrease, falling 6.2% to $5,125,874.
The decrease at the 99th percentile was 3.9 percentage points greater than the decline at the 90th percentile. All three measures have now recorded annual declines for 31 consecutive months.
These measurements represent different levels of the luxury housing market. The 90th percentile identifies the entry point for luxury listings, while the 95th and 99th percentiles represent progressively higher-priced properties.
The figures do not establish that every luxury property declined in value at the reported rate. Instead, they describe changes in national listing-price thresholds, which can be influenced by the composition and pricing of available inventory.
Florida Markets Report Luxury Housing Price Growth
Despite the national declines, several metropolitan areas recorded annual increases in their luxury listing-price thresholds.
Naples-Marco Island, Florida, led the markets examined with a 9% increase. North Port-Bradenton-Sarasota, Florida, followed at 7.7%, while Charleston-North Charleston, South Carolina, recorded growth of 4.7%.
These results illustrate differences between national housing indicators and individual metropolitan conditions. Similar regional variations appear in U.S. home price trends, although those figures measure completed transactions rather than luxury listing thresholds.
Of the 43 metropolitan areas analyzed by Realtor.com, 12 recorded annual increases of at least 1% in their 90th-percentile listing-price thresholds. Five of those markets were in Florida.
Naples-Marco Island’s 9% increase contrasted with the national decline of 2.3%, representing an 11.3-percentage-point difference. North Port-Bradenton-Sarasota also recorded growth substantially above the national result.
The findings indicate that local luxury housing conditions varied considerably in October. While national thresholds continued to decline, selected metropolitan markets maintained higher asking-price levels than a year earlier.
Luxury Homes Spend Fewer Days on the Market
Realtor.com’s October report also examined listing duration and the proportion of residential properties priced at $1 million or more.
Entry-level luxury listings spent a median of 73 days on the market, five fewer than in October 2025. The reduction occurred despite the continued annual decline in national luxury listing-price thresholds.
At higher price levels, properties in the 95th percentile spent a median of 81 days on the market, four fewer than a year earlier. Listings in the 99th percentile spent 97 days on the market, a six-day annual decrease.
These figures show that listing durations shortened across all three luxury segments, although the most expensive properties generally remained available longer.
Meanwhile, homes listed for at least $1 million accounted for 12.3% of total residential listings in October, down 0.5 percentage points from the previous year.
The smaller share of million-dollar listings provides another measure of available housing inventory. However, it does not independently establish whether the number of completed luxury transactions increased or declined.
Listing duration and asking-price thresholds measure different aspects of the market. Shorter listing periods may accompany lower asking-price benchmarks without necessarily indicating that every property is selling more quickly or at a reduced price.
National and Regional Results Show Different Housing Conditions
The October 2026 findings highlight differences between nationwide luxury listing-price trends and conditions within individual metropolitan areas.
Nationally, the entry-level luxury threshold continued its extended period of annual declines. Higher-priced segments recorded larger percentage decreases, while luxury listings generally spent fewer days on the market than a year earlier.
Regional results were more varied. Florida accounted for five of the 12 metropolitan areas where the entry-level luxury threshold increased by at least 1%, while other markets continued to record annual reductions.
These differences are relevant to buyers, sellers and real estate professionals evaluating luxury residential properties.
National listing-price thresholds provide broad market benchmarks but cannot determine the value of an individual home. Local inventory, property characteristics, location and comparable transactions remain important considerations when assessing a specific property.
The report also distinguishes listing prices from completed sales. Changes in asking-price thresholds should not be interpreted as equivalent changes in final transaction prices or homeowner equity.
Realtor.com’s October data therefore provide separate measurements of national luxury asking prices, regional price differences, listing duration and million-dollar inventory.
Frequently Asked Questions
How much did U.S. luxury home prices decline in October 2026?
Realtor.com reported a 2.3% annual decline in the national entry-level luxury listing-price threshold, which reached $1,197,014 in October 2026. This figure measures asking-price thresholds rather than completed home sales.
What is the national entry-level luxury home price threshold?
The entry-level luxury threshold represents the 90th percentile of residential listing prices, identifying the starting price for the highest-priced 10% of listings. In October 2026, the national threshold was $1,197,014.
Which U.S. metropolitan area recorded the highest luxury-price growth?
Naples-Marco Island, Florida, recorded the strongest annual increase among the metropolitan areas examined, at 9%. North Port-Bradenton-Sarasota followed with 7.7%, while Charleston-North Charleston recorded 4.7%.
How long have national luxury listing-price thresholds been declining?
All three national luxury listing-price thresholds recorded their 31st consecutive month of year-over-year declines in October 2026.
How did the highest luxury price segments perform?
The 95th-percentile threshold declined 4.1% annually to $1,873,040, while the 99th-percentile threshold fell 6.2% to $5,125,874. Both recorded larger percentage decreases than the entry-level luxury segment.